|
RomRaider
Documentation
Community
Developers
|
| Author |
Message |
|
Jon [in CT]
|
Post subject:  Posted: Posted: Fri Jul 06, 2007 1:54 pm |
|
 |
| Experienced |
Joined: Wed Jul 26, 2006 3:19 pm
Posts: 650
Location: Connecticut, USA
|
|
Have you ever looked at a scatter plot with x = injector pulse width and y = AF Learning #1?
|
|
| Top |
|
 |
|
Jon [in CT]
|
Post subject: Posted: Fri Jul 06, 2007 2:00 pm |
|
|
| Experienced |
Joined: Wed Jul 26, 2006 3:19 pm
Posts: 650
Location: Connecticut, USA
|
|
Oops. Nevermind. I was thinking about injector scaling when I misread the thread title.
|
|
| Top |
|
|
|
mickeyd2005
|
Post subject: Posted: Fri Jul 06, 2007 2:01 pm |
|
|
| Administrator |
 |
Joined: Wed Oct 25, 2006 12:32 am
Posts: 3040
|
|
I'll do that this weekend. I don't have any PW datalogs... did I miss something? Is AFR learning a function of pulse width? I thought it was a function of MAF. My current spreadsheet uses total correction so hopefully it won't affect the answer.
I was going to set up a PW scatter plot to determine injector scaling and latency but I haven't done that yet.
|
|
| Top |
|
|
|
maveric7911
|
Post subject: Posted: Fri Jul 20, 2007 11:29 am |
|
|
| Experienced |
Joined: Mon Jan 15, 2007 12:36 am
Posts: 126
Location: Maryland
|
|
| Top |
|
|
|
mickeyd2005
|
Post subject: Posted: Fri Jul 20, 2007 12:38 pm |
|
|
| Administrator |
|
Joined: Wed Oct 25, 2006 12:32 am
Posts: 3040
|
|
The spreadsheet that I wrote has difficulty clearing the graph ranges. I thought I fixed it, but I guess not. You have to manually go into range 5 and range 6 and give it a range of from row 2 to row 10 for both curves and then re run the graph.
Here is your data in the spreadsheet. I didn't copy your MAF table over.
Keep in mind that I don't know the true logic of how the ecu determines AFR learning so I am just guessing at the logic and throwing out data that I don't think is valid.
This spreadsheet should get you closer to AFR Learning < 3 %. Usually, I end up with between -0.78 and -2.34% AFR learning.
Take a look a the pivot table values. Don't assume the MAF table adjustments are correct. You have to make a judgement call on what % change to use. I usually look for data that has more than 20 data points and an average AFR between 14.5 and 14.7.
Try to do another datalog driving at constant throttle up a sloped freeway. That should get you some higher MAF values.
For the low end, you can make those adjustments based upon a fast idle. Let the car sit for 15 seconds idling and make sure the car is fully warmed up. Then start datalogging at different rpms. That should get you all the data that you need for MAF(v) less than 1.9 volts.
After you make the adjustments for MAF(v) less than 2.8 volts, you'll need a wideband O2 sensor to scale your MAF table above 2.8 volts. Be careful because your AFR learning will no longer be adding the 2.34% fuel in open loop.
Last edited by mickeyd2005 on Mon Aug 13, 2007 3:29 pm, edited 1 time in total.
|
|
| Top |
|
|
|
dwmoss
|
Post subject: Posted: Wed Aug 08, 2007 4:57 pm |
|
|
| Newbie |
Joined: Tue May 02, 2006 12:02 pm
Posts: 96
Location: NE PA
|
|
mickeyd,
great thread, thanks for putting this together
usdm02wrx
stock map (af423)
147000 miles
prodrive cai
prodrive axleback
silicone turbo inlet (bpm)
silicone intercooler hoses (samco)
stock uppipe
stock downpipe
the file was huge, so i removed the input data tab
it looks like i need to get more low data points - fast idle etc....
dm
|
|
| Top |
|
|
|
mickeyd2005
|
Post subject: Posted: Wed Aug 08, 2007 5:13 pm |
|
|
| Administrator |
|
Joined: Wed Oct 25, 2006 12:32 am
Posts: 3040
|
|
Do the latest defs for 16 bit ecus have the OL/CL status flag?
I'm revising the algorithm and changing the graph into a pivot table. The pivot table seems to be more accurate since the graphing method uses an equation and sometimes the equation gives skewed results if the data is incorrect in some areas. The pivot table also forces the user to look carefully at the results to make sure that they have valid data in areas of interest.
Keep in mind that fast idle datalogs requires accurate injector latency values. It looks like you have stock injectors so a fast idle datalog will help you map your low range in your MAF table.
|
|
| Top |
|
|
|
dwmoss
|
Post subject: Posted: Wed Aug 08, 2007 5:28 pm |
|
|
| Newbie |
Joined: Tue May 02, 2006 12:02 pm
Posts: 96
Location: NE PA
|
mickeyd2005 wrote: Do the latest defs for 16 bit ecus have the OL/CL status flag?
I'm revising the algorithm and changing the graph into a pivot table. The pivot table seems to be more accurate since the graphing method uses an equation and sometimes the equation gives skewed results if the data is incorrect in some areas. The pivot table also forces the user to look carefully at the results to make sure that they have valid data in areas of interest.
Keep in mind that fast idle datalogs requires accurate injector latency values. It looks like you have stock injectors so a fast idle datalog will help you map your low range in your MAF table.
latest defs do have the OL/CL status flag, that was used for gathering/sorting this data
i'd be interested in seeing any revisions to your spreadsheet
stock injectors, check...
dm
|
|
| Top |
|
|
|
mickeyd2005
|
Post subject: Posted: Wed Aug 08, 2007 10:06 pm |
|
|
| Administrator |
|
Joined: Wed Oct 25, 2006 12:32 am
Posts: 3040
|
|
dwmoss can you winzip your unedited .csv file and email it to me? I want to compare it against 32 bit ecus
my email is my screen name at yahoo.com. thanks.
|
|
| Top |
|
|
|
dwmoss
|
Post subject: Posted: Wed Aug 08, 2007 10:28 pm |
|
|
| Newbie |
Joined: Tue May 02, 2006 12:02 pm
Posts: 96
Location: NE PA
|
mickeyd2005 wrote: dwmoss can you winzip your unedited .csv file and email it to me? I want to compare it against 32 bit ecus
my email is my screen name at yahoo.com. thanks.
not a problem at all...
what would you like? the original logs or your spreadsheet with the tab I deleted to reduce the size? [OOPS... just saw your looking for the .csv's] - logs zipped and sent
i took the data on a drive back from the beach (4 or 5 logs - is there any way to disable the rear defrost button from auto shut off?) and a couple from the next day to try to gather more data.
dm
|
|
| Top |
|
|
|
mickeyd2005
|
Post subject: Posted: Wed Aug 08, 2007 10:50 pm |
|
|
| Administrator |
|
Joined: Wed Oct 25, 2006 12:32 am
Posts: 3040
|
|
IIRC, the test version of RomRaider can datalog without using the defrost button.
|
|
| Top |
|
|
|
bboy
|
Post subject: Posted: Mon Aug 13, 2007 3:00 pm |
|
|
| Newbie |
Joined: Sat May 12, 2007 9:09 pm
Posts: 50
|
|
Am I correct that on the last tab, MAF Table, the percentages in Row 10 would apply to any MAF calibration that you have downloaded into the ECU, even if the values in the spread sheet are ones that mickey placed there?
In other words: If I subtract or add the percentage to each site that needs adjustment, it doesn't matter what the MAF values that are written in Previous Table Row 7? I can just multiple times 1.073 or .947 or a 7.3% change up or down.
BTW thank you very much for the sheet, it's very useful.
|
|
| Top |
|
|
|
mickeyd2005
|
Post subject: Posted: Mon Aug 13, 2007 3:09 pm |
|
|
| Administrator |
|
Joined: Wed Oct 25, 2006 12:32 am
Posts: 3040
|
|
Row 6 is the MAF(v) from the MAF table that was used for the datalogs.
Row 7 is the MAF(g/s) from the MAF table that was used for the datalogs.
Row 10 is the desired changes in percentage that you want to apply to Row 7. The cells with the white background are derived from the charts. The cells with the grey background are values that the macro did not change and entered in 0%. You can manually modify any value in Row 10 after you use the macro.
Row 14 becomes the new MAF(g/s). You can cut and paste this into RomRaider.
Row 16 to Row 21 are for reference only.
Last edited by mickeyd2005 on Mon Aug 13, 2007 3:52 pm, edited 5 times in total.
|
|
| Top |
|
|
|
mickeyd2005
|
Post subject: Posted: Mon Aug 13, 2007 3:32 pm |
|
|
| Administrator |
|
Joined: Wed Oct 25, 2006 12:32 am
Posts: 3040
|
|
I updated the spreadsheet.
Hopefully, the new spreadsheet will automatically reset the graphs. The previous ones would sometimes not reset the graphs if there wasn't enough new data.
I was hoping to get the injector scaling and latency derivation incorporated as well using a flag to determine if you want to scale the MAF or scale the injectors. However, I still need to check some equations.
|
|
| Top |
|
|
|
fasterthanurwrx
|
Post subject: Posted: Mon Aug 13, 2007 4:04 pm |
|
|
| Experienced |
 |
Joined: Mon Sep 18, 2006 10:55 am
Posts: 229
|
Hey,
Shouldn't it say [Selection1D] below PREDICTED TABLE so that when you only copy "Airflow g/s" you can just paste it right in RomRaider?
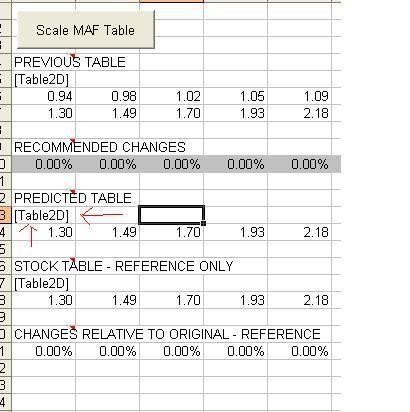
-John
|
|
| Top |
|
|
Who is online |
Users browsing this forum: No registered users and 6 guests |
|
You cannot post new topics in this forum
You cannot reply to topics in this forum
You cannot edit your posts in this forum
You cannot delete your posts in this forum
You cannot post attachments in this forum
|
|


